CryptoBullet Crypto Signals — Independent Review
CryptoBullet is a Telegram crypto trading signals channel tracked by PNL Mama. Over the last 30 days this channel published 9 closed trades with an actual win rate of 78%. On a virtual account that puts 10% of its money into every trade and ignores the leverage written in the post, $1000 would have become $1 020 over 90 days. PNL Mama monitors every signal at the source and publishes the verified track record without edits.
CryptoBullet — Verified Performance Summary
These results are tracked independently by PNL Mama and computed automatically from CryptoBullet's published signals against real exchange prices — no edits, no cherry-picking. Of the last 9 closed trades, 7 finished in profit (78% win rate). The worst recorded trade returned -100%, and the average losing trade -100%. At its worst the account was 7.6% below its own peak, the profit factor 2.32, and the longest losing streak 2 trades in a row.
CryptoBullet — Full Track Record
PNL Mama has been tracking CryptoBullet since . Over the full tracking period, 41 trades were closed, 22 of them in profit (54% all-time win rate), for a total realized P&L of -223 USDT on a flat $100 stake per trade. The all-time maximum drawdown is -1019 USDT on that same stake with a profit factor of 0.86. The 30-day summary above shows current form; the full record shows sample size and trajectory.
CryptoBullet Trading Style
Across all tracked signals, CryptoBullet trades 39.06% long and 60.94% short.
Most Traded Pairs by CryptoBullet
- BTCUSDT — 22 trades
- ETHUSDT — 8 trades
- ATSUSDT — 3 trades
- NEARUSDT — 3 trades
- SOLUSDT — 3 trades
- COINUSDT — 2 trades
Recent Trades by CryptoBullet
- ZROUSDT LONG ×10 — LIVE +28% (06 Oct 2026)
- ZECUSDT SHORT ×10 — +66% (28 Sep 2026)
- NEARUSDT LONG ×10 — +66% (26 Sep 2026)
- ONDOUSDT LONG ×10 — +66% (24 Sep 2026)
- PYTHUSDT LONG ×10 — +66% (23 Sep 2026)
- ENAUSDT LONG ×10 — +66% (22 Sep 2026)
- BTCUSDT SHORT ×10 — LIVE -15% (21 Sep 2026)
- NEARUSDT LONG ×10 — LIVE +203% (20 Sep 2026)
- SUIUSDT LONG ×10 — LIVE +458% (18 Sep 2026)
- OPUSDT LONG ×10 — +66% (18 Sep 2026)
Market Outlook — CryptoBullet's market view
A view on the market, not a trade. No entry, no result — kept for context, never counted in win rate or rankings.
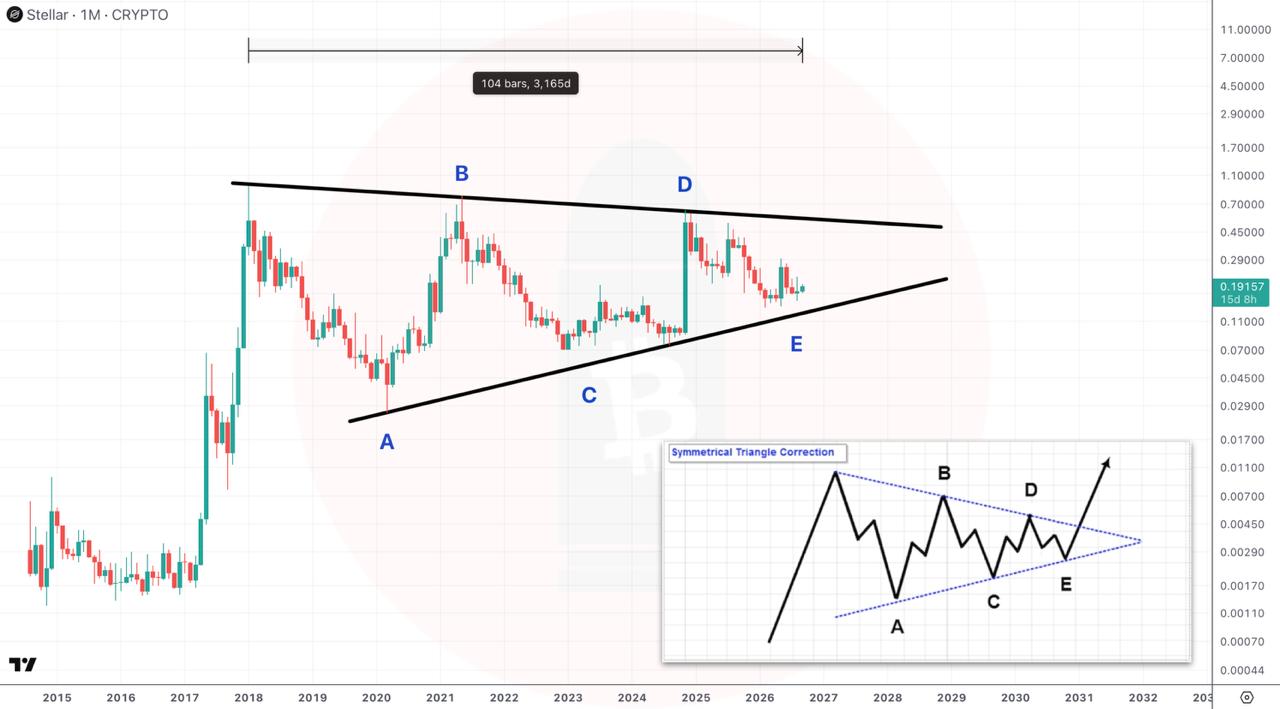
XLMUSDT
What CryptoBullet said
Starcoin has been moving within a very wide narrowing range for nine years, and now the price is approaching its upper boundary — the market is about to decide whether it will break out sharply upward or retreat downward again.
If price moves up: if price breaks above the upper boundary of the range → a sharp rise with large amplitude is likely
If price moves down: if price fails to break above the upper boundary → return to the lower part of the range is likely
Published •
BTCUSDT
What CryptoBullet said
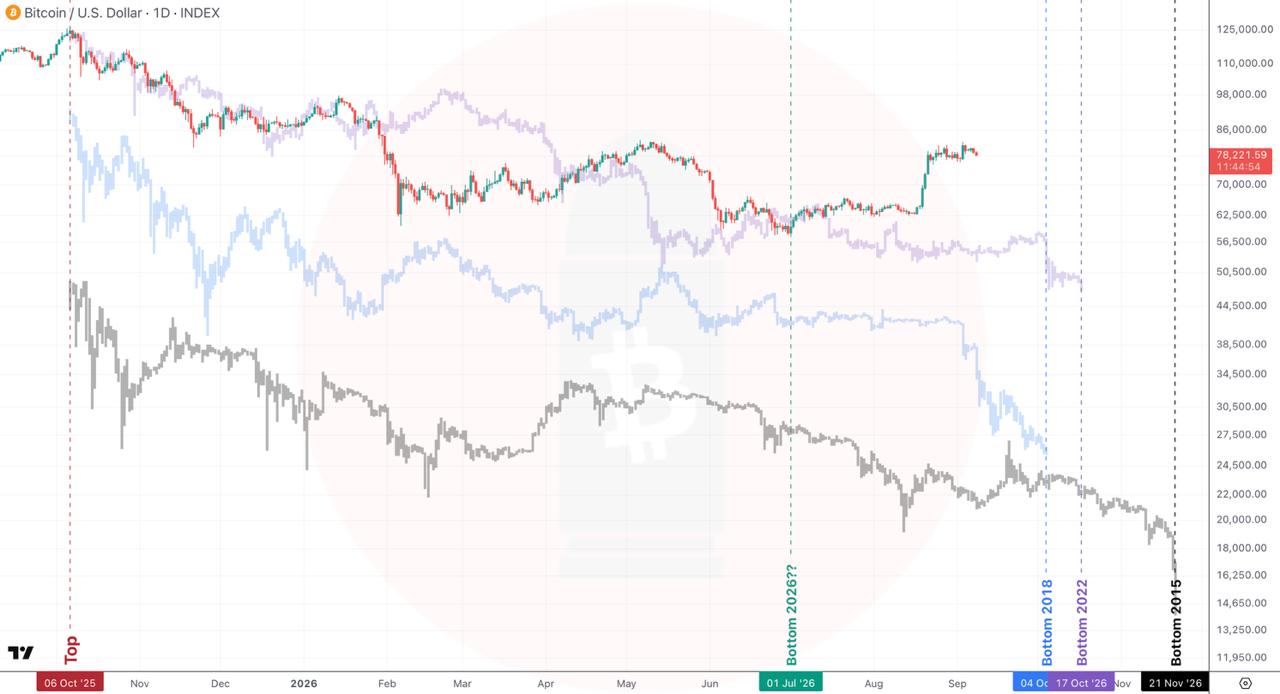
Comparing the current picture with past long downturns in bitcoin — the author waits until December 1 to decide whether the bottom is already in or the price will fall further
If price moves up: if July 1 ($57,750) was already the lowest point, by December 1 the author plans to fully switch to the upside view
If price moves down: if not, the lowest point could form on October 4, October 17, or November 21, matching the timing of past downturns
Published •
OTHERS
What CryptoBullet said
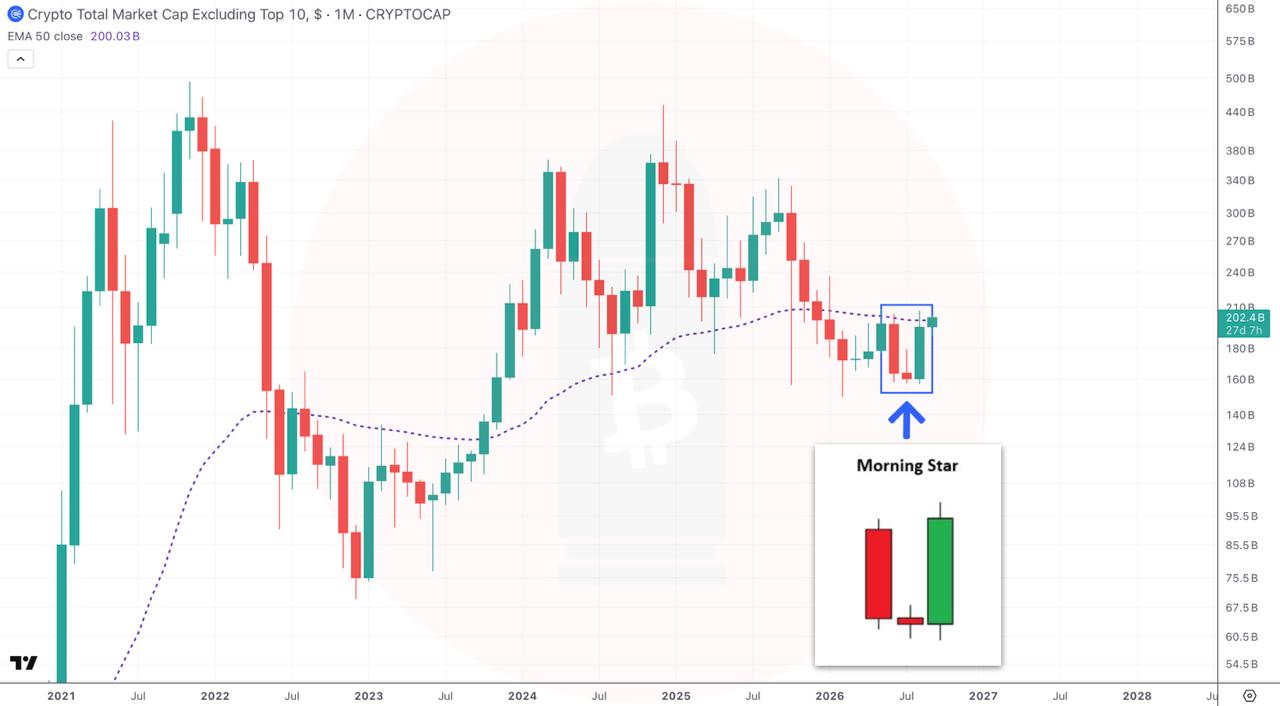
Total altcoin capitalization excluding top-10 showed signs of ending its decline by late summer and may turn upward
If price moves up: If September continues the ongoing reversal → total altcoin capitalization may grow noticeably
Published •
BTCUSDT
What CryptoBullet said
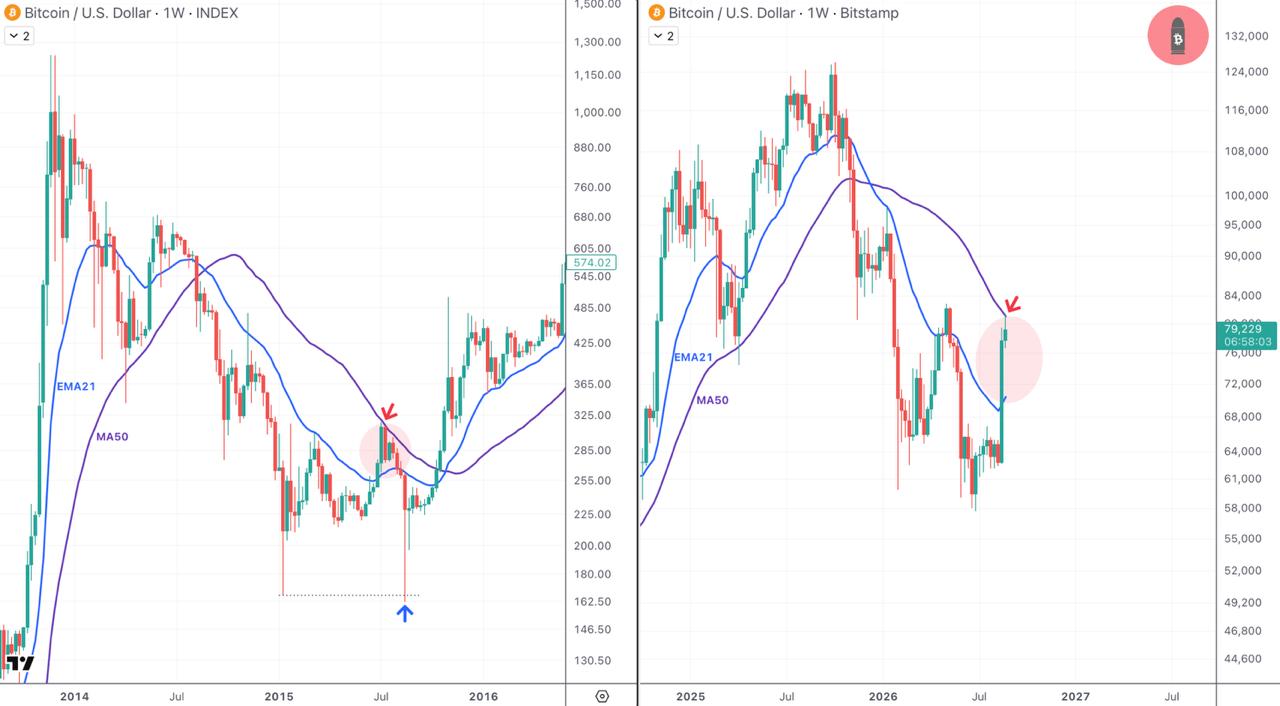
Currently, Bitcoin's price behavior resembles 2015 — after rising, it has approached a key long-term level. If buyers don't hold above it, a deep pullback is possible, as happened then.
If price moves up: if price can firmly hold above the level around 84 000 → growth will likely continue
If price moves down: if price fails to hold above the level around 84 000 → a deep pullback is possible, as in 2015, when gains were completely erased and the low was retested
Published •
BTCUSDT
What CryptoBullet said
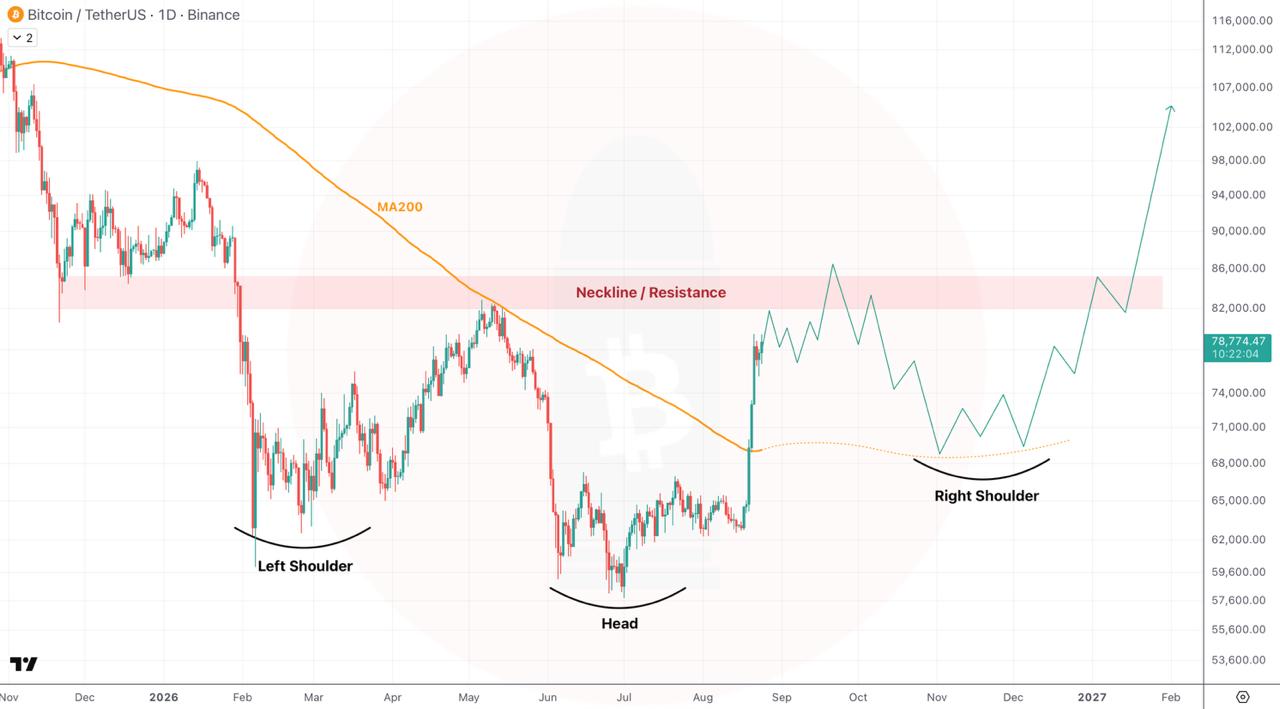
Bitcoin recently rallied but the analyst is cautious because key on-chain levels weren't reached. They expect a major upward move in December-January if a classic reversal pattern completes.
If price moves up: If Bitcoin forms a new local low above the previous one over the next two months and then rises above the 82,000-86,000 zone, the pattern points to a move toward 102,000-104,000
Published •
BTCUSDT
What CryptoBullet said
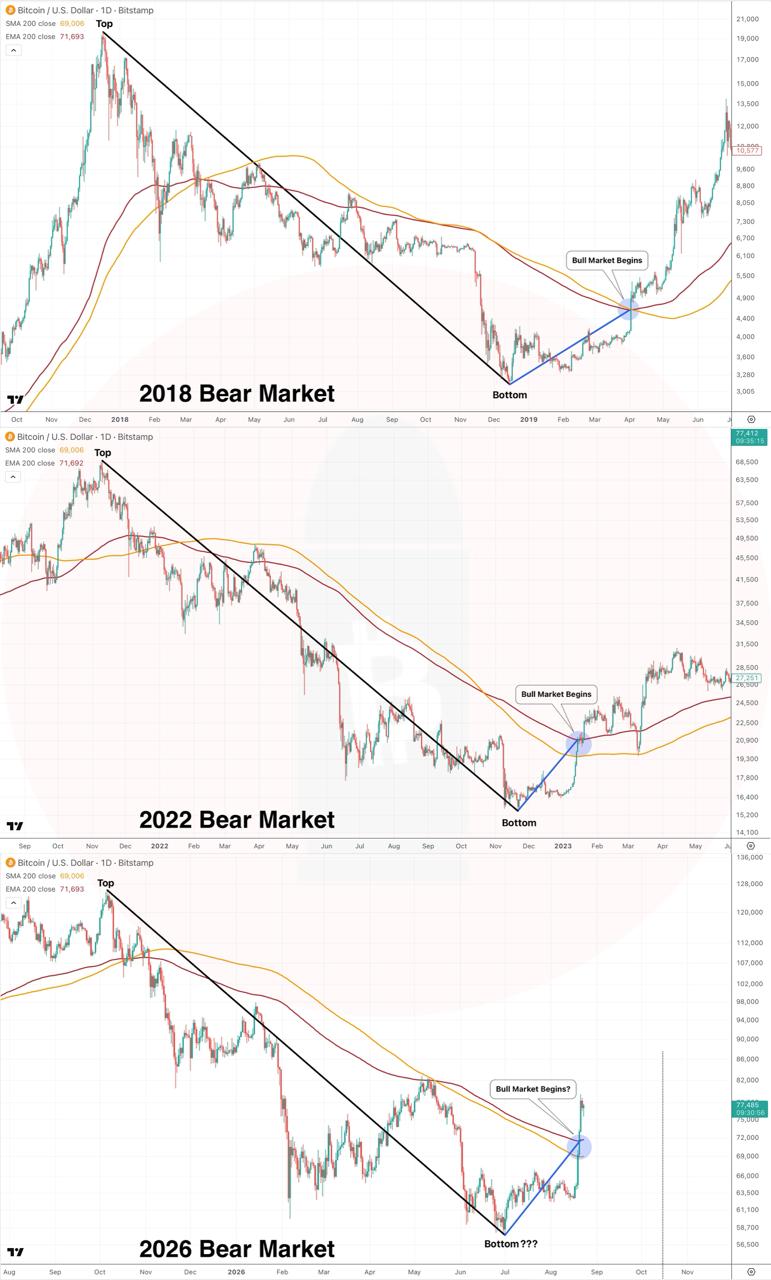
Price sharply rose above key moving averages, as it did at the end of previous prolonged declines (2018 and 2022) — the market is attempting to turn upward, but the question of the bottom remains open.
If price moves up: if by December 1 the market does not show new lows → author will fully switch to bullish scenario
If price moves down: if the market manages to fully retrace this rise by mid-October → bearish decline may continue beyond October
Published •